This climate change explained guide covers what is warming the planet, the evidence behind it and where scientific assessments say it is heading. Human greenhouse gas emissions are the main cause.
Each section below summarises one part of the picture and points to a dedicated page for the detail, from the gases themselves to the cost of delay.
Climate change and the greenhouse effect
Climate is the long-run pattern of weather. Climate change is a lasting shift in that pattern, and the shift now under way is warming. The Intergovernmental Panel on Climate Change (IPCC) states in its Sixth Assessment Report synthesis that human activities, principally through emissions of greenhouse gases, have unequivocally caused global warming, with global surface temperature reaching 1.1°C above 1850-1900 in 2011-2020.
The mechanism has been understood for a long time. NASA’s evidence page records that in 1856 Eunice Foote showed that carbon dioxide and water vapor in Earth’s atmosphere trap escaping infrared (heat) radiation, and that in 1896 Svante Arrhenius first predicted that changes in atmospheric carbon dioxide levels could substantially alter the surface temperature through the greenhouse effect.
The greenhouse effect itself is natural and necessary. According to NASA’s explanation of the causes, sunlight reaches the surface, is absorbed and is radiated back as infrared heat, and about 90% of that heat is then absorbed by greenhouse gases and re-radiated, slowing heat loss to space. The problem is not the effect but its strengthening: more of these gases in the air means more heat retained.
It helps to separate two ideas that are often mixed up. Weather is what the atmosphere does on a given day; climate is the statistics of weather over decades. A cold week does not contradict a warming climate, just as one warm week does not prove it. Scientists therefore look at long records, averaged over many places and many years, and ask whether the average, the range and the extremes have shifted.
The US EPA’s climate basics page describes the greenhouse effect as natural and necessary to support life, and describes a carbon cycle in which carbon continually moves from the atmosphere to the earth and then back to the atmosphere. Burning fossil fuels moves carbon that was locked underground into that cycle faster than natural processes can move it out again, so the amount in the air builds up.
Units are worth a moment, because they appear throughout climate reporting. Concentrations are given in parts per million or parts per billion; the US EPA overview of greenhouse gases illustrates one part per million as one drop of water diluted into about 13 gallons of liquid. Emissions are given in tonnes of CO2 equivalent so that gases with different strengths can be compared on one scale. The same EPA page notes that these gases can remain in the atmosphere for different amounts of time, ranging from a few years to thousands of years, so a gas that is short-lived can matter for near-term warming while a long-lived one shapes warming for centuries.
The main greenhouse gases are carbon dioxide, methane, nitrous oxide and the fluorinated gases, with water vapor acting as an amplifier rather than an original cause. How each one is produced and how strongly each one warms is the subject of that page.
The evidence of a changing climate
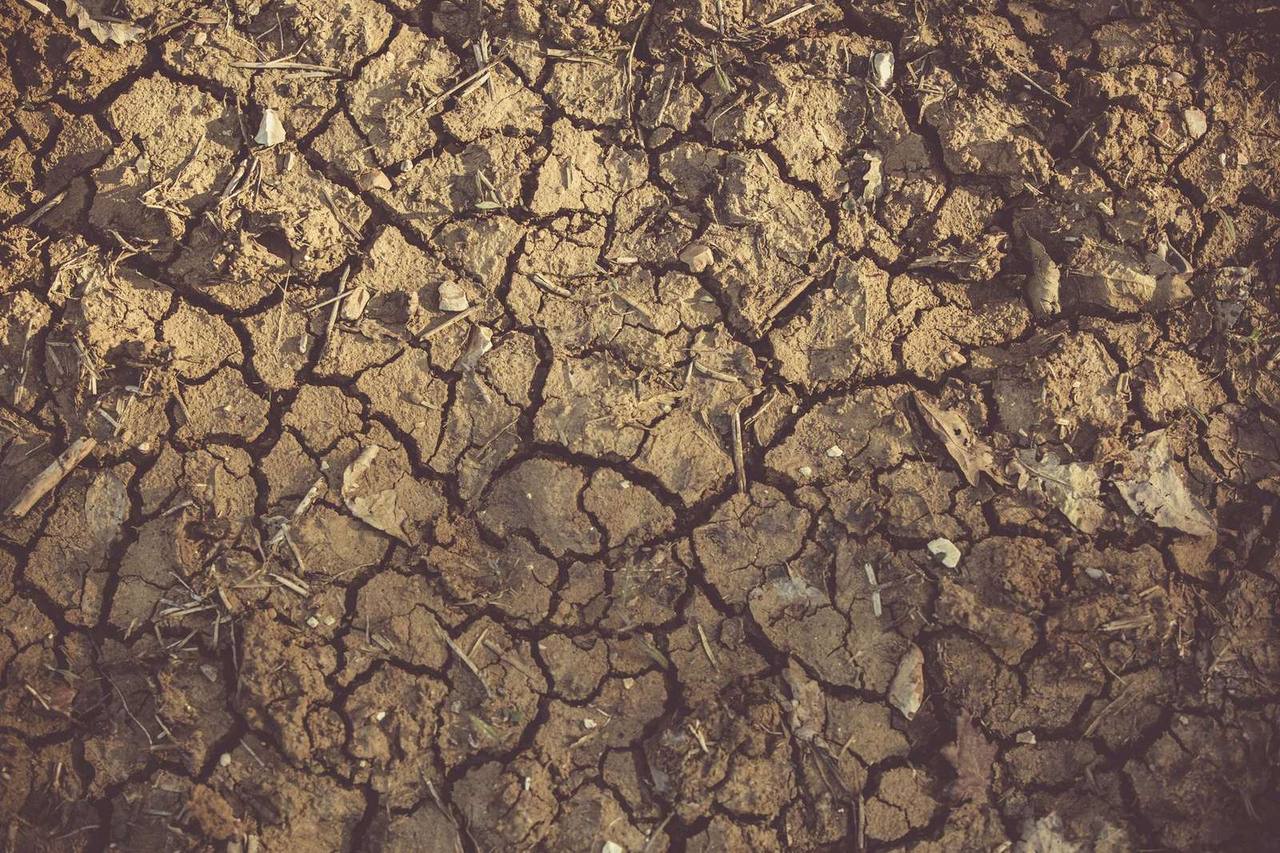
No single measurement carries the case. Thermometers, satellites, ocean floats, ice cores and tree rings point the same way. The IPCC Working Group I summary reports that global surface temperature has increased faster since 1970 than in any other 50-year period over at least the last 2000 years, and that ocean warming accounted for 91% of the heating in the climate system.
The ice record tells a similar story. NASA reports that Greenland lost an average of 279 billion tons of ice per year between 1993 and 2019, while Antarctica lost about 148 billion tons of ice per year. The same page notes that, over the last 800,000 years, there have been eight cycles of ice ages and warmer periods, with the end of the last ice age about 11,700 years ago, and that current warming is occurring roughly 10 times faster than the average rate of warming after an ice age.
Seas are rising as the ocean warms and land ice melts. In the IPCC synthesis, global mean sea level increased by 0.20 m between 1901 and 2018, and the rate climbed to 3.7 mm per year between 2006 and 2018. The same summary is the source for both figures.
Extremes are shifting too. The IPCC assessment says it is virtually certain that hot extremes, including heatwaves, have become more frequent and more intense across most land regions since the 1950s, and that marine heatwaves have approximately doubled in frequency since the 1980s.
The ocean is also taking up carbon. NASA states that the ocean has absorbed between 20% and 30% of total anthropogenic carbon dioxide emissions in recent decades, and that the acidity of surface ocean waters has increased by about 30% since the Industrial Revolution, which is a direct chemical consequence of the extra carbon dioxide.
The evidence is also cumulative in a second sense: independent methods have been cross-checked for generations. NASA notes that Earth-orbiting satellites and new technologies have helped scientists see the big picture, and that ice cores, tree rings, ocean sediments and coral reefs give a record of past conditions against which today can be compared. When land stations, ocean instruments and satellites agree, the chance that the signal is a measurement artefact is small.
The drivers of the warming
Human emissions are the driver, and the chain of evidence is direct. NASA says that industrial activity has raised atmospheric carbon dioxide levels by nearly 50% since 1750. The IPCC Working Group I summary puts the increases in concentration since 1750 at 47% for carbon dioxide, 156% for methane and 23% for nitrous oxide, and reports that in 2019 annual averages reached 410 ppm for carbon dioxide, 1866 ppb for methane and 332 ppb for nitrous oxide. Atmospheric carbon dioxide was higher in 2019 than at any time in at least 2 million years.
Direct measurement backs this up. The Mauna Loa record, which NOAA’s Global Monitoring Laboratory describes as started by C. David Keeling of the Scripps Institution of Oceanography in March of 1958, is the longest record of direct atmospheric carbon dioxide measurements. How such records are made and what they show is covered under atmospheric co2 levels, which a reader can use to follow the trend to the present.
Natural causes have been tested and do not explain the recent warming. Per NASA, since 1750 the average amount of energy from the Sun either remained constant or decreased slightly, and scientists have observed cooling in the upper atmosphere with warming at the surface, the pattern expected from greenhouse gases rather than from a more active Sun. Past climate swings, by contrast, were largely tied to small variations in Earth’s orbit.
The cumulative scale matters because carbon dioxide persists. The IPCC synthesis estimates historical cumulative net carbon dioxide emissions from 1850 to 2019 at 2400 GtCO2, of which about 42% occurred between 1990 and 2019. Land and ocean have taken up a near-constant proportion, globally about 56% per year, of carbon dioxide emissions from human activities over the past six decades, according to the Working Group I summary. The remainder stays in the air.
Attribution studies weigh the possible causes against each other. In the IPCC synthesis, the best estimate of total human-caused warming is 1.07°C, with well-mixed greenhouse gases contributing a warming of 1.0°C to 2.0°C, while natural solar and volcanic drivers changed global surface temperature by only -0.1°C to +0.1°C. The gap between the first and last of those ranges is the reason the assessment treats the human role as established. Some human activity cools rather than warms: the US EPA notes that aerosols that reflect sunlight, such as sulfur emissions from burning coal, have a cooling effect, which is one reason the effect of greenhouse gases is partly masked.
Feedbacks can amplify the initial push. The US EPA explains that as greenhouse gas concentrations increase and global temperatures rise, the total amount of water vapor in the atmosphere also increases, further amplifying the warming effect. The same page says that human releases of water vapor, such as evaporation from irrigation and power plant cooling, have been determined to have a negligible effect on global climate. Water vapor is therefore treated as a response to warming rather than as a lever people pull directly, and that is why policy attention falls on carbon dioxide, methane, nitrous oxide and the fluorinated gases instead.
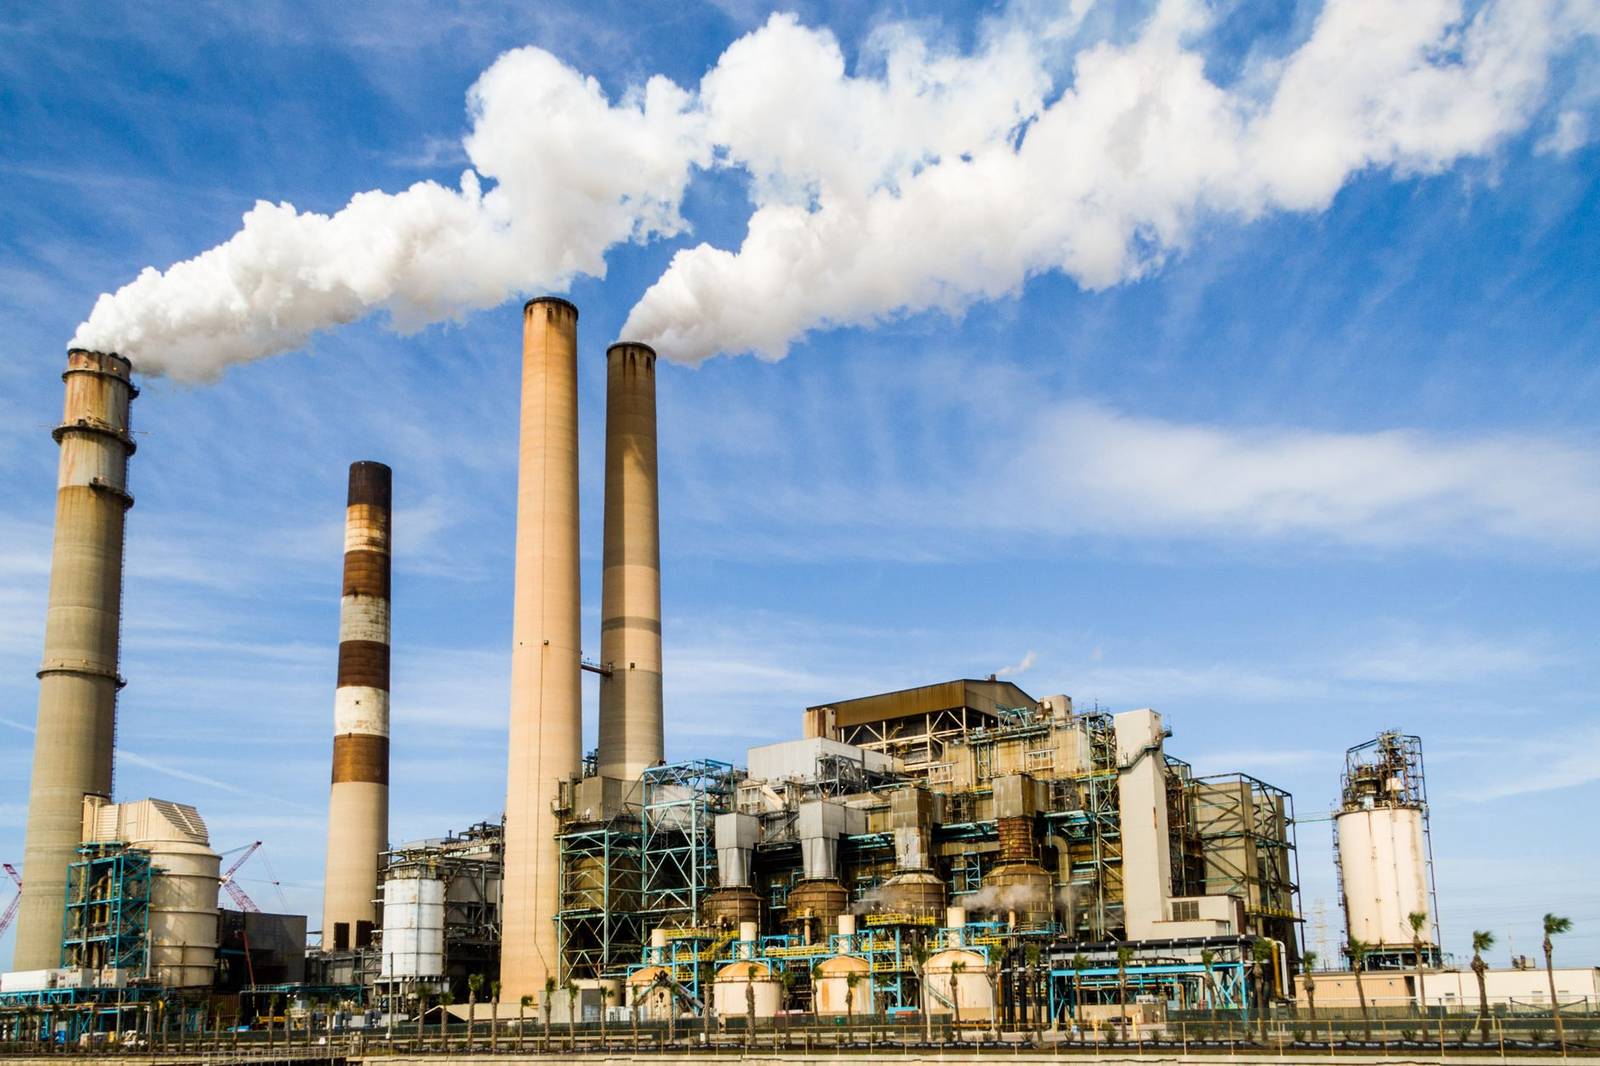
Where emissions come from
Total net anthropogenic emissions were 59 GtCO2-eq in 2019, about 12% higher than in 2010 and 54% higher than in 1990, as reported in the IPCC Working Group III summary. The unit CO2-eq lets different gases be added together; the conversion rests on global warming potential, a measure of how much energy a ton of a gas absorbs compared with a ton of carbon dioxide.
The US EPA’s global overview, based on IPCC data for 2019, splits emissions by economic sector as follows.
| Sector | Share of 2019 global greenhouse gas emissions |
|---|---|
| Electricity and heat production | 34% |
| Industry | 24% |
| Agriculture, forestry and other land use | 22% |
| Transportation | 15% |
| Buildings (direct emissions) | 6% |
The sector shares above come from the US EPA global greenhouse gas overview, which notes that electricity use in buildings is counted under electricity and heat production.
Fossil fuel use is the primary source of carbon dioxide, and the same EPA page lists agriculture, waste management, energy production and biomass burning as contributors to methane. It adds that the top ten emitting countries together represent approximately 67% of total emissions in 2020, so national action matters a great deal.
These sector shares are a guide to where emission cuts can have the largest effect: cleaner electricity and heat, lower-emission industry, changes in how land is used, and efficiency in transport and buildings. The US EPA also points out that almost all of the world’s transportation energy comes from petroleum-based fuels, which ties the transport sector closely to oil demand.
A business or household can place its own share within this picture by asking what is a carbon footprint and how it is measured, which moves the discussion from global totals to individual activities.
Impacts already visible
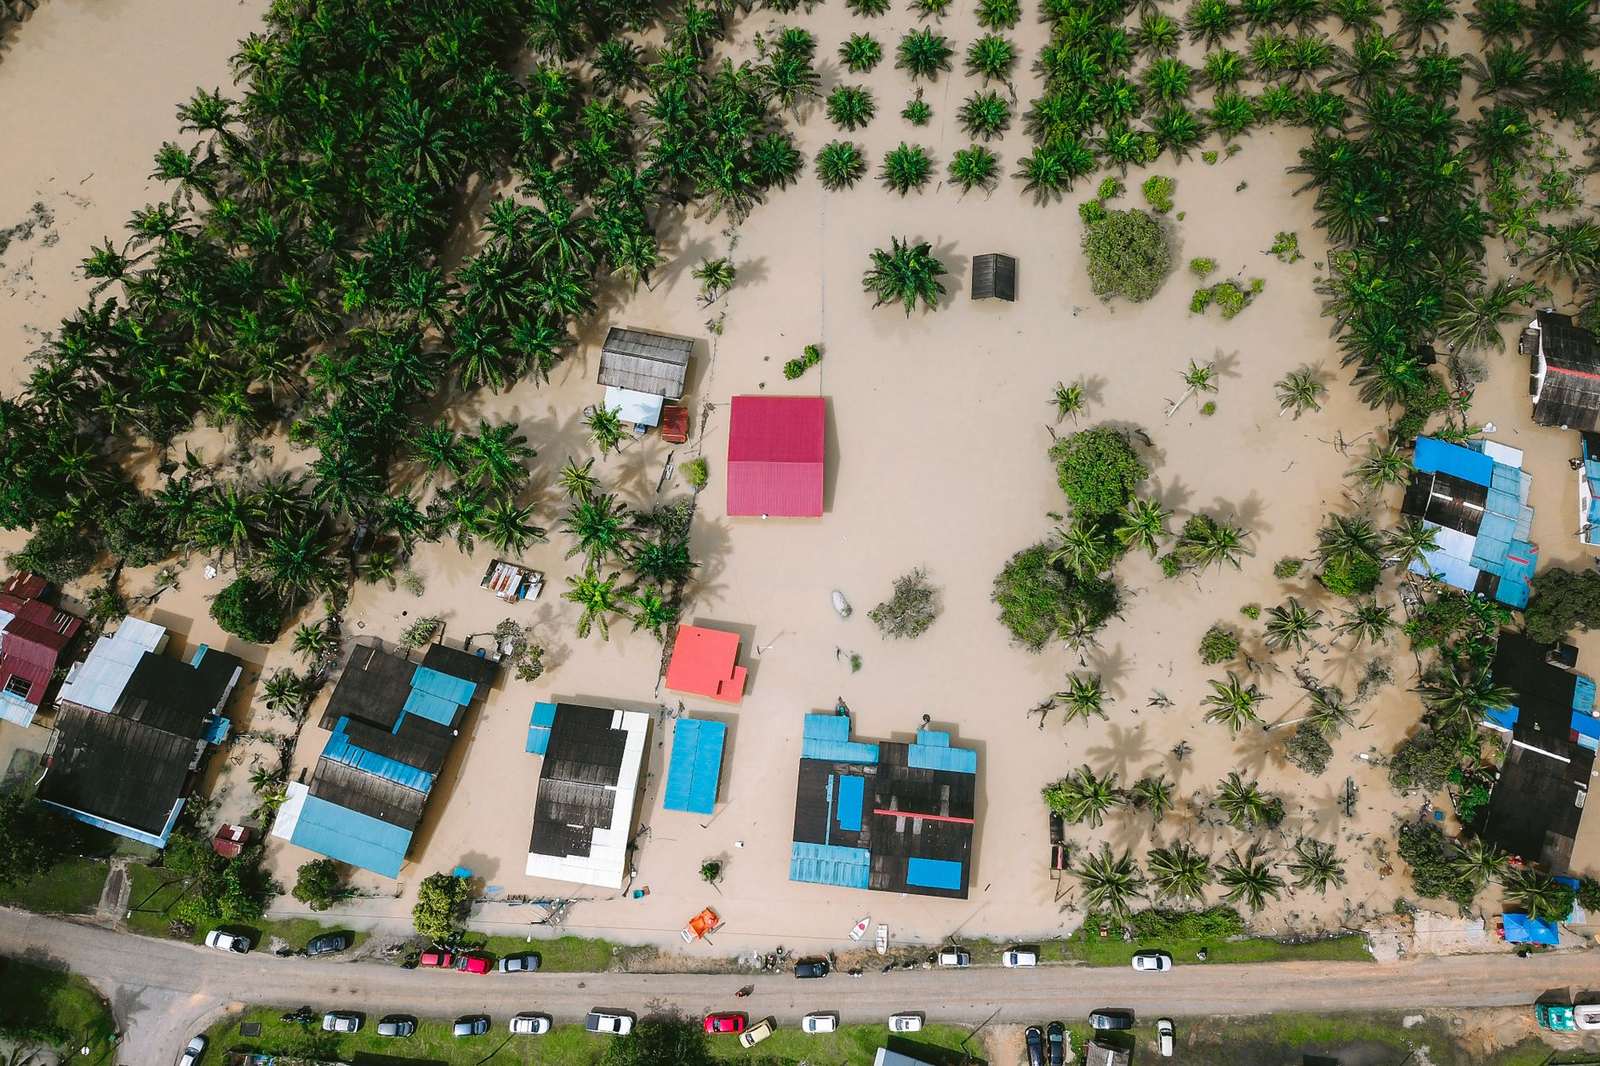
Impacts are not only a future concern. NASA states that effects scientists long predicted are now occurring, including sea ice loss, accelerated sea level rise and longer, more intense heat waves. The IPCC synthesis estimates that approximately 3.3 to 3.6 billion people live in contexts that are highly vulnerable to climate change, which is why impacts fall unevenly.
Vulnerability depends on more than exposure to a hazard. A coastal city with sea defences, a farming region with irrigation and an island with few resources can face the same sea level or the same drought very differently. The IPCC synthesis states that climate change has reduced food security and affected water security, and it identifies the largest adverse impacts in locations and communities across Africa, Asia, Central and South America, the Arctic and small islands. Planning for those differences is usually called adaptation, as distinct from mitigation, which cuts the emissions that cause warming in the first place.
The regional detail, from heat and flooding to ecosystems and food, is set out under climate change impacts. The key point at global scale is how impacts scale with warming: the IPCC states that risks and projected adverse impacts and related losses and damages from climate change escalate with every increment of global warming.
That has an economic side. Delay changes the price of eventual action, a theme developed in the page on the cost of climate inaction, and attempts to put a single value on each extra tonne emitted are covered under the social cost of carbon.
The outlook and how responses are organised
Future warming depends on future emissions. The IPCC synthesis gives best estimates of warming for 2081-2100 across three of its illustrative scenarios.
| Emissions scenario | Best estimate of warming, 2081-2100 |
|---|---|
| Very low (SSP1-1.9) | 1.4°C |
| Intermediate (SSP2-4.5) | 2.7°C |
| Very high (SSP5-8.5) | 4.4°C |
These scenario figures are taken from the IPCC Sixth Assessment Report synthesis summary; the assessment also states that the best estimate of reaching 1.5°C falls in the near term in the scenarios and modelled pathways it considered.
Policies already in place do not yet match the lowest scenarios. The Working Group III summary projects a median global warming of 3.2°C by 2100 if policies implemented by the end of 2020 are not strengthened. For international goals and the way progress is tracked, see paris agreement goals. For one regional policy package and its numeric targets, see eu 2030 climate targets.
Mitigation pathways give a sense of the scale of change involved. According to the Working Group III summary, modelled pathways that limit warming to 1.5°C with no or limited overshoot involve net global greenhouse gas emission reductions of 43% by 2030 and 84% by 2050 relative to 2019 levels. The synthesis report adds that deep, rapid and sustained reductions would lead to a discernible slowdown in global warming within around two decades, which is why timing matters as much as the end point.
Two further routes appear in public discussion. Organisations first measure and cut emissions, and some then use credits for emissions that remain, a topic explained under what is carbon offsetting. A business that makes public climate claims should also check the advertising and consumer rules where it operates.
Frequently asked questions
Is the climate always changing naturally?
It has changed throughout Earth’s history, and NASA’s evidence page attributes most past changes to small variations in Earth’s orbit. The present warming differs: NASA reports it is occurring roughly 10 times faster than the average rate of warming after an ice age, and the IPCC attributes it to human activities.
How much has the planet warmed so far?
The IPCC synthesis puts global surface temperature at 1.1°C above 1850-1900 in 2011-2020. NASA’s effects page repeats the same figure for the warming already caused by human emissions of heat-trapping gases.
Is carbon dioxide the only greenhouse gas that matters?
No. Methane, nitrous oxide and fluorinated gases also trap heat, and the US EPA lists a global warming potential for methane of 27 to 30 over 100 years and for nitrous oxide of 273 times that of carbon dioxide. Carbon dioxide remains the central focus partly because, as the US EPA notes, the increases in its atmospheric concentration that its emissions cause will last thousands of years.
How sensitive is the climate to extra carbon dioxide?
The IPCC’s Working Group I summary gives a best estimate of 3°C for equilibrium climate sensitivity, with a likely range of 2.5°C to 4°C.
Can warming still be limited?
The IPCC states that outcomes depend on emissions choices: its lowest scenario ends the century near 1.4°C, while its highest ends near 4.4°C. Every increment of warming escalates risk, so reductions at any stage matter.