Atmospheric CO2 levels are reported as parts per million of dry air, and the longest direct record, kept at Mauna Loa in Hawaii, shows a steady rise year after year.
This page is part of the climate change explained guide. It describes what monitoring networks and public science agencies report, and it does not offer advice.
The parts per million unit
Carbon dioxide is a trace gas, so its abundance is quoted as a mole fraction. NASA notes that parts per million refers to the number of carbon dioxide molecules per million molecules of dry air. NOAA’s measurement guide gives a worked example: 413 parts per million of CO2 means that in every million molecules of dry air there are on average 413 CO2 molecules.
Scientists use dry air for a practical reason. The amount of water vapor in a sample changes from place to place and hour to hour, and that would make the CO2 figure drift for reasons unrelated to carbon dioxide itself. Reporting against dry air keeps a reading comparable between a mountaintop, a polar station and a ship.
Measurement at Mauna Loa
The benchmark record comes from a volcano. NOAA states that the carbon dioxide data on Mauna Loa constitute the longest record of direct measurements of CO2 in the atmosphere, started by C. David Keeling of the Scripps Institution of Oceanography in March of 1958. NOAA began its own measurements there in May of 1974, and the two series ran in parallel afterwards.
The site matters. NOAA describes the observatory as sitting at an elevation of 3397 meters on the flank of the volcano, high above local sources and sinks of CO2 such as traffic, crops and forests. The published monthly values are built from hourly averages taken only during background conditions, so a passing plume of local air does not distort the trend.
The instrument has changed over time. NOAA explains that in April of 2019, a new CO2 analyzer was installed at Mauna Loa that uses a technique called Cavity Ring-Down Spectroscopy, which replaced an earlier infrared absorption analyzer. The method times how quickly laser light fades inside a cavity of mirrors, and that decay is tied to how much CO2 the air contains.

Readings are anchored to reference gases and cross-checked. The same NOAA document says that flask samples are sent to its laboratory in Boulder, Colorado, where they are analyzed together with thousands of other air samples from all over the world. Independent flask results and the in-situ analyzer let the team check one against the other.
Nature occasionally interrupts the series. NOAA’s notes say that observations from December 2022 to July 4, 2023 are from a site at the Maunakea Observatories, roughly 21 miles north, because the eruption of the Mauna Loa Volcano suspended measurements there. Observations at the original site resumed in July 2023.
The modern record
NOAA’s annual analysis, summarized by climate.gov, puts global average atmospheric carbon dioxide at 422.8 parts per million in 2024, a new record high. The same source says the 2024 increase was 3.75 ppm, the largest one-year increase on record. At Mauna Loa itself, the annual average for 2024 was 424.61 ppm.
The current monthly figures keep climbing. The NOAA trends page lists 426.07 ppm for September 2026 against 424.37 ppm for September 2025, a Mauna Loa monthly mean that is updated each month.
The speed of change has itself changed. Climate.gov reports that in the 1960s, atmospheric carbon dioxide increased by about 0.8 ppm per year on average, rising to 1.6 ppm per year in the 1980s. In the last decade, 2015 to 2024, the annual increase has accelerated to 2.6 ppm per year. A faster rate of growth on top of an already higher level is why the record bends upward on the long chart.
Looking back before the instruments
Direct measurement is a modern practice, so earlier conditions come from air trapped in ice. NASA explains that the Antarctic ice core measures CO2 levels trapped in tiny air bubbles from the past that were preserved when the ice formed. Joined to the Mauna Loa series, the ice core extends the picture far back in time.
What that longer record shows is striking. Climate.gov states that during the ice age cycles of the past million years or so, atmospheric carbon dioxide didn’t get any higher than 300 ppm, and that before the Industrial Revolution started in the mid-1700s, the level was 280 ppm or less. By the time continuous observations began at Mauna Loa in 1958, global atmospheric carbon dioxide was already 315 ppm.
Put side by side, the natural swings between glacial and warmer periods were slow and stayed within a band, while the modern climb is steep and sits well outside it. That contrast is the reason the CO2 curve is among the most widely used indicators in climate science.
The yearly zigzag in the curve
The Mauna Loa chart is not a smooth line. Climate.gov explains that the seasonal cycle of highs and lows is driven by Northern Hemisphere summer vegetation growth, which reduces atmospheric carbon dioxide, and winter decay, which increases it. Because most of the planet’s land lies in the north, the whole atmosphere breathes in and out with the seasons.
NOAA therefore publishes two lines on its graphs. One is the raw monthly mean, and the other is the same data after correction for the average seasonal cycle, which makes the long-term trend easier to read. The agency’s growth-rate page also notes that the annual growth rate measured at Mauna Loa is not the same as the global growth rate, but it is quite similar.
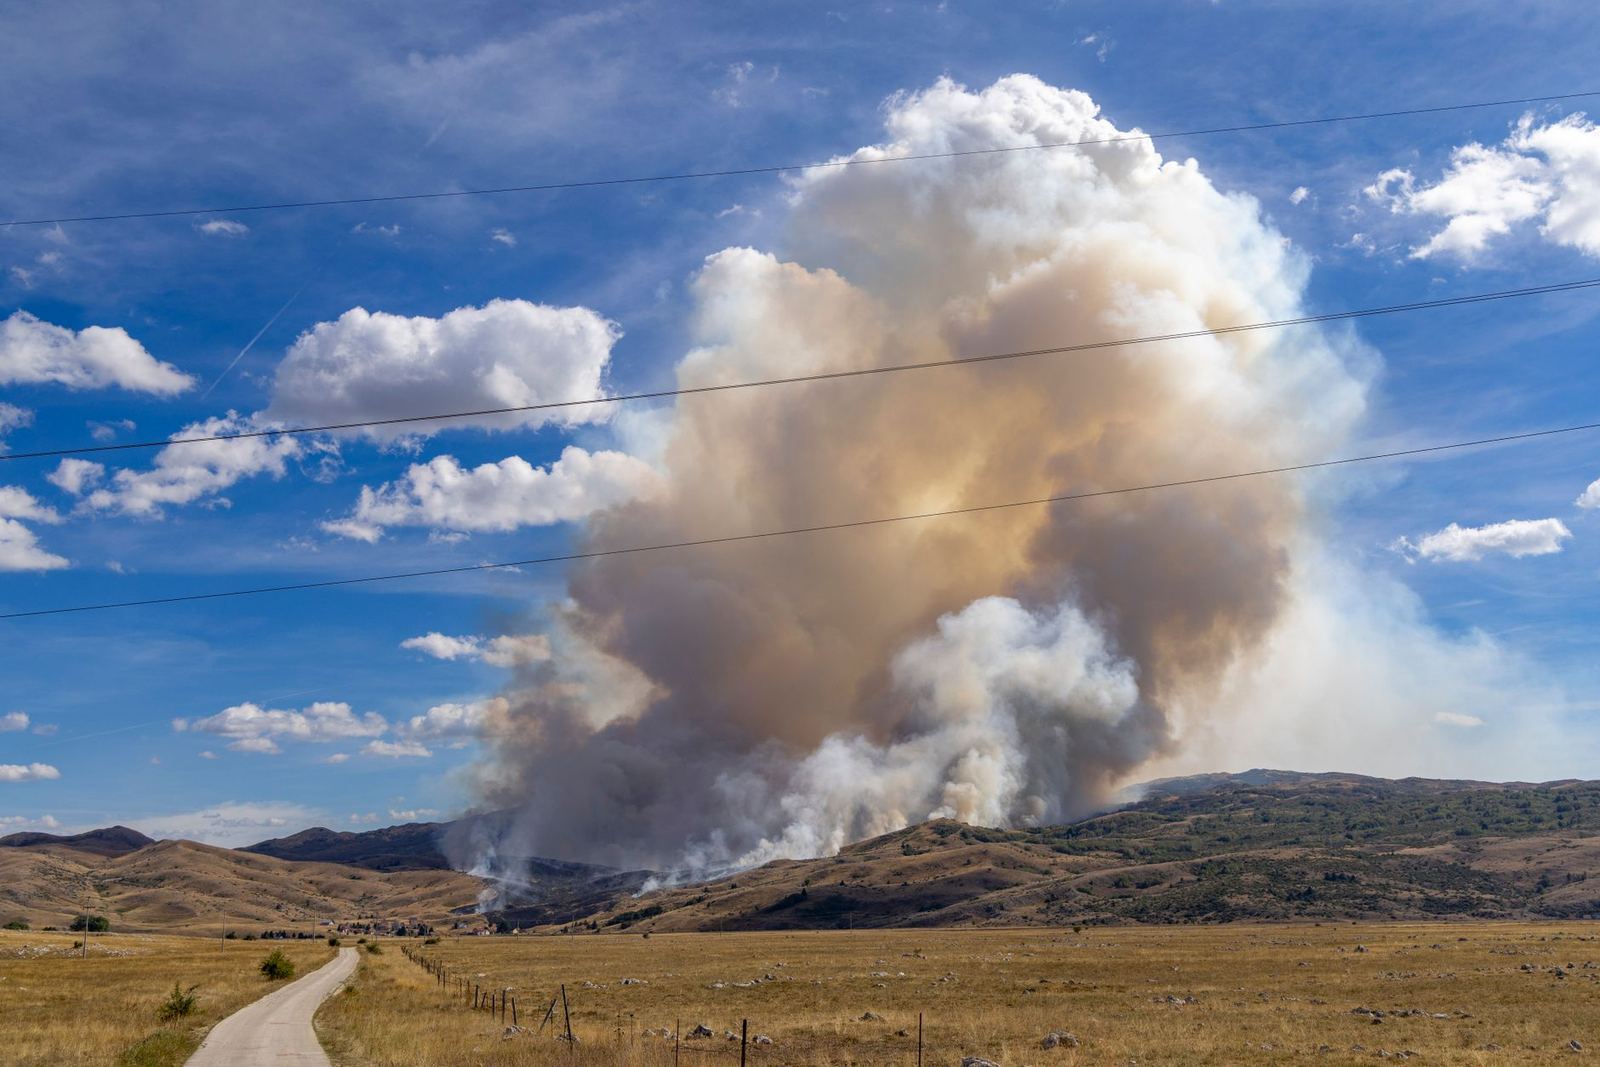
Year-to-year jumps have natural causes layered on human emissions. Climate.gov attributes the large 2024 rise partly to record heat and drought, adding that large forest fires in both the Amazon and Canada contributed to the 2024 global increase.
Using the numbers carefully
A concentration is a stock, not a flow. It records how much CO2 is in the air today, which depends on emissions, on how much carbon forests and oceans absorb, and on how long the gas persists. Counting what a business or country emits in a year is a different measurement, and the two should not be mixed up in a sentence.
CO2 is also only one of several warming gases, and they differ in strength and lifetime. The page on global warming potential explains how those gases are put on a common scale. How governments set limits on future warming, and how they track progress, is covered in the summary of Paris Agreement goals.
Anyone publishing climate figures, including a business making public climate claims, should check the advertising and consumer rules that apply where they operate.
Frequently asked questions
What does ppm stand for?
It stands for parts per million, the number of CO2 molecules in each million molecules of dry air.
Why is Mauna Loa used as the reference station?
It hosts the longest direct record of CO2 in the atmosphere, and its high-altitude location samples well-mixed background air rather than nearby local sources.
Why do monthly values rise and fall within a year?
Northern Hemisphere plants absorb CO2 in the growing season and release it as they decay in winter, which creates a regular yearly cycle on top of the upward trend.
How do scientists know the levels before 1958?
They analyze air bubbles trapped in ice cores, which preserve samples of past atmospheres.